Visual representation helps in identifying trends, patterns, and correlations, facilitating data-driven decision-making.
Data Visualization
Data Visualization and Business Intelligence (BI) services empower organizations to transform raw data into meaningful insights.
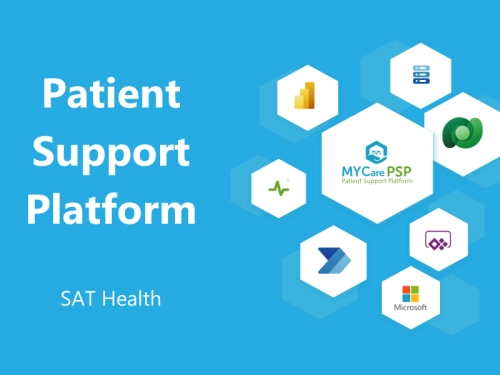
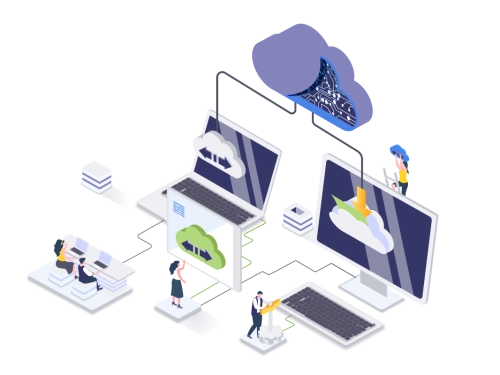
The journey of data from its origin to a structured, analyzable state includes several steps of advanced data engineering. It involves ETL/ELT (extract, transform, load) data pipelines and data integration workflows that are equipped with the latest industry tools and technologies from Microsoft.
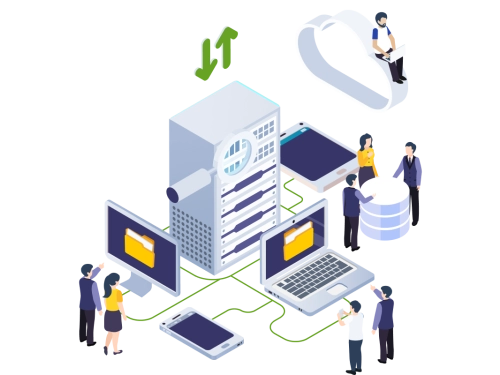
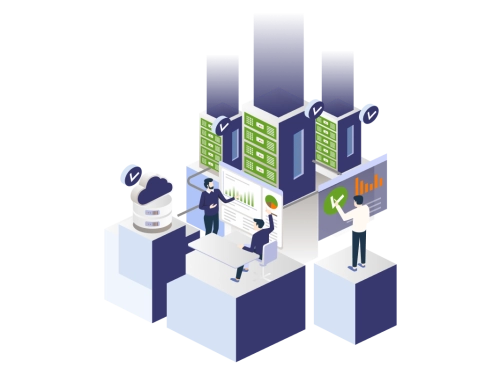
What does this mean? This means we can design a system that unifies data from different sources, find and correct any errors, standardize the data format and interpretation, remove duplicate data, and store the data in a central repository to enable businesses to visualize complex datasets through interactive dashboards, charts, graphs, and maps. This visual representation helps in identifying trends, patterns, and correlations, facilitating data-driven decision-making.
Key Features:
- Data Integration: Seamless integration with various data sources.
- Data Engineering: Design and implement data system for storing, transforming, and enabling data for analysis.
- Interactive Dashboards: Real-time data visualization for quick insights.
- Custom Reports: Tailored reports to meet specific business needs.
- Predictive Analytics: Forecasting future trends based on historical data.
- Self-Service BI: Empowering users to create their own reports and dashboards.
- Enhanced Decision-Making: Visual data representation simplifies complex data, making it easier for stakeholders to make informed decisions.
- Trend Identification: Quickly identify and analyze trends and patterns within the data.
- Improved Data Accessibility: Centralized data access ensures that all relevant information is available to decision-makers.
- Real-Time Insights: Access to real-time data allows for timely and proactive decision-making.
- User Empowerment: Self-service BI tools enable users to generate their own insights without relying on IT.
- Increased Efficiency: Streamlined data processes and automated reporting save time and resources.
- Better Strategic Planning: Data-driven insights support long-term strategic planning and goal setting.
- Competitive Advantage: Leveraging data insights helps businesses stay ahead of the competition.
- Cost Reduction: Identifying inefficiencies and areas for improvement can lead to significant cost savings.
- Enhanced Customer Understanding: Better analysis of customer data leads to improved customer satisfaction and loyalty.


